Business Dashboard Development: What Should You Track?
- #business dashboard development
- #business intelligence
- #data analytics
- #kpi tracking
- #business reporting
- #custom software
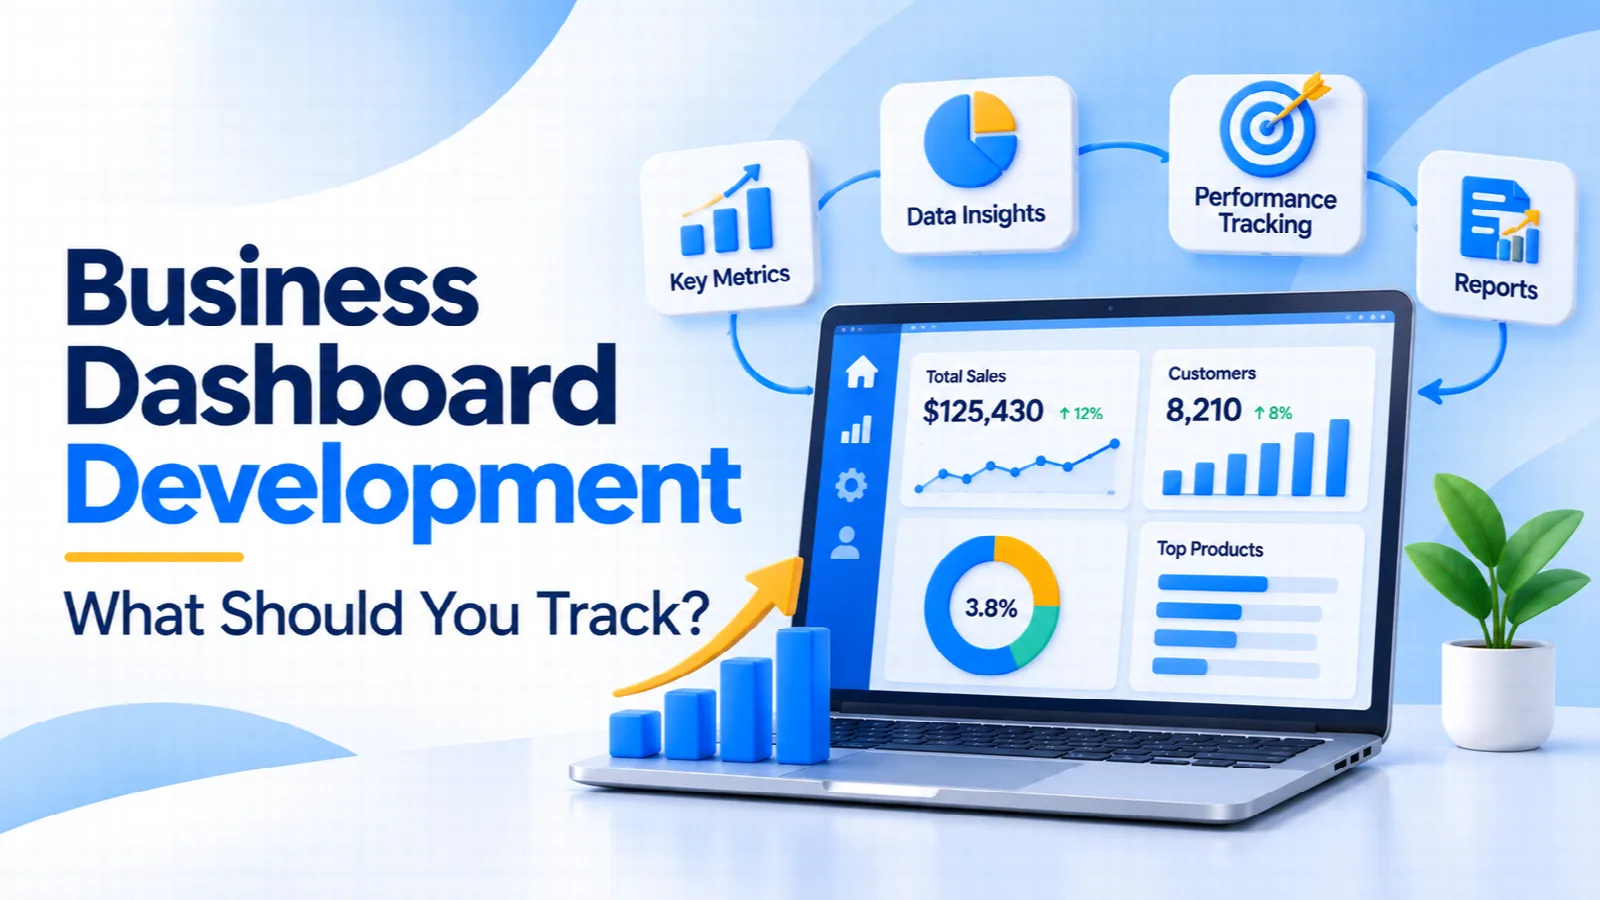
Business owners often have information spread across sales tools, accounting software, spreadsheets, and operational systems. Finding the right numbers can take time, especially when every department prepares reports differently.
Business dashboard development brings important business information into a central view. It helps owners and managers monitor performance, identify changes, and review important activities without searching through multiple reports.
But a dashboard is useful only when it shows information that supports decisions. Adding more charts does not automatically make reporting better.
This guide explains which metrics to track, how to organise dashboard data, and what to consider before developing a business dashboard.
In this guide:
- What a business dashboard should do
- Which metrics different departments can track
- How to choose useful KPIs
- How to plan dashboard design and development
- Common mistakes to avoid
What is a business dashboard and why does it matter?
A business dashboard is a visual interface that presents selected business information in one place. It may include charts, summary figures, tables, status indicators, and filters.
For example, a business owner may want to review sales activity, outstanding payments, customer enquiries, and operational tasks. Instead of opening several applications, a dashboard can bring selected information together.
A dashboard is not the same as a detailed report.
- Dashboard: Shows important information for regular monitoring.
- Report: Provides more detailed information about a specific activity or period.
- KPI: A Key Performance Indicator is a measurable value used to evaluate progress towards an important business objective.
A dashboard can support different users:
- Business owners may need an overview of revenue, costs, and business performance.
- Sales managers may monitor leads, opportunities, and follow-up activity.
- Finance teams may review invoices, payments, and outstanding balances.
- Operations managers may track pending tasks, stock movement, or delivery status.
The information should match each user's responsibilities. A single dashboard does not need to show every metric to everyone.
Which business metrics should you track?
The right metrics depend on your business model, goals, and operating processes. Start with the information that helps your team make regular decisions.
Here are practical examples by department.
1. Sales and lead management
A sales dashboard can help managers understand the movement of enquiries through the sales process.
Useful metrics include:
- New leads received
- Leads assigned to each salesperson
- Follow-ups pending
- Qualified opportunities
- Proposals shared
- Deals won and lost
- Sales value by period
For example, if many enquiries remain in the same pipeline stage, a manager can review whether follow-ups are delayed or whether those enquiries need additional attention.
Lead volume alone is not enough. Review lead quality and progression as well.
2. Finance and payments
A finance dashboard can help business owners review important financial activities.
Possible metrics include:
- Revenue recorded during a selected period
- Invoices generated
- Payments received
- Outstanding invoice balances
- Overdue invoices
- Operating expenses
- Cash flow information, where reliable data is available
For example, a business may want to identify overdue invoices and review which customers need payment follow-ups.
Financial figures should come from appropriate accounting records. A dashboard should not replace accounting checks or formal financial reporting.
3. Operations and inventory
An operations dashboard can show whether important activities are progressing as expected.
Depending on the business, useful metrics may include:
- Orders received and processed
- Pending orders
- Stock availability
- Low-stock items
- Purchase orders awaiting receipt
- Deliveries in progress
- Pending internal tasks
A transport business may need trip status and vehicle availability. A distributor may need stock levels and purchase information.
The dashboard should reflect the actual operating workflow rather than display unrelated metrics.
4. Customer support
Businesses that handle regular customer requests may monitor:
- New support requests
- Open and pending tickets
- Resolved requests
- Average response time
- Requests by category
- Escalated issues
- Customer feedback, where collected consistently
These metrics can help managers identify support workload and recurring issues.
A response-time figure should have a clear definition. For example, decide whether it measures the first response or the time taken to resolve a request.
5. Marketing and website performance
A marketing dashboard may combine information from website analytics, advertising platforms, and lead management systems.
Possible metrics include:
- Website visits
- Traffic sources
- Enquiry form submissions
- Campaign leads
- Cost per lead, where advertising cost data is available
- Landing page performance
It is important to distinguish website activity from business outcomes. More website visits do not necessarily mean more qualified enquiries.
How do you choose the right KPIs?
A common dashboard problem is trying to track too many things. When every available metric receives equal attention, users may struggle to identify what matters.
Use this process to choose KPIs.
- Start with a business objective. Decide what the dashboard should help you understand. Examples include improving lead follow-up, monitoring outstanding payments, or reviewing stock availability.
- Identify the decision. Ask what action a manager might take after reviewing the information.
- Choose a relevant metric. Select a measure that helps evaluate progress towards the objective.
- Define the calculation. Explain exactly how the metric is calculated. For example, define which invoices count as overdue.
- Set the reporting period. Decide whether the metric should update daily, weekly, monthly, or when an event occurs.
- Assign responsibility. Identify who owns the data and who should review the result.
- Add context. Where useful, compare the current value with a previous period, an agreed target, or a relevant business segment.
For example, if your objective is to improve lead follow-up, the dashboard could show new leads, unassigned leads, and overdue follow-up tasks.
Those figures give the sales manager a clearer view of where attention may be needed.
How should you plan business dashboard development?
A useful dashboard starts with requirements and data planning, not visual design alone.
Before development, consider these areas.
Identify dashboard users
List the people who will use the dashboard and the information each group needs.
An owner may need a business overview, while a sales employee may need assigned leads and follow-up tasks. Their screens should not necessarily be identical.
Identify data sources
Business information may be stored in accounting software, CRM platforms, inventory applications, spreadsheets, or databases.
Check how each source provides information and whether it supports suitable integrations. Also identify duplicate records and inconsistent field names.
Define update frequency
Not every metric needs real-time updates. Some information may be sufficient when refreshed daily or weekly.
Choose a refresh schedule based on how quickly users need to act and how the source systems provide data.
Plan permissions and security
Decide which users can view specific information. Financial, employee, and customer records may require restricted access.
Use suitable authentication, permissions, and data protection practices. Avoid displaying sensitive information to users who do not need it.
Design for clarity
Use charts and visual elements that match the information.
For example:
- Line charts can show changes over time.
- Bar charts can compare categories.
- Summary cards can highlight selected values.
- Tables can show detailed records.
- Filters can help users review a specific date range, team, or location.
Keep important information easy to find. Avoid decorative charts that do not help users understand or act on the data.
Test the information
Check calculations, filters, permissions, and data refresh behaviour. Compare dashboard values with the original systems to confirm that the information is consistent.
Businesses with specialised reporting needs or multiple connected systems may consider custom software development. For help assessing systems and integration requirements, explore IT consulting and digital transformation.
Common mistakes to avoid
Tracking too many metrics. A dashboard filled with charts can become difficult to use. Prioritise metrics that support clear business decisions.
Using unclear definitions. Different teams may calculate the same metric differently. Document definitions and calculation rules before development.
Combining inconsistent data. Connecting multiple systems does not automatically make their information accurate. Review duplicates, missing records, and data formats.
Ignoring the users. A dashboard designed only around management preferences may not support employees' daily work. Involve the people who will use it.
Showing outdated information without context. Display when the data was last updated. Users should know whether they are reviewing current or historical information.
Ignoring permissions. Not every employee needs access to all business information. Plan user roles before launch.
Treating a dashboard as a replacement for detailed reports. Dashboards provide an overview. Users may still need detailed records to investigate unusual figures or verify transactions.
Not reviewing the dashboard after launch. Business goals and reporting needs change. Review whether the selected metrics remain useful and update the dashboard when requirements evolve.
Frequently asked questions
What should a business dashboard include?
It should include information that supports the decisions its users make. Common examples include sales activity, finance, customer enquiries, inventory, and operational status. The exact metrics depend on the business.
What is the difference between a dashboard and a KPI report?
A dashboard presents selected information for regular monitoring, often through charts and summary figures. A KPI report focuses on defined performance indicators and may provide more detailed analysis over a selected period.
Can a business dashboard connect to existing software?
Yes, when the existing applications provide suitable integration options and the required access is available. The development team should review data formats, APIs, permissions, and update frequency before planning the integration.
Should a small business build a custom dashboard?
Not necessarily. Standard reporting features may be enough for businesses with simple requirements. Custom development may be useful when the business needs specialised metrics, multiple integrations, role-based views, or a specific reporting workflow.
How often should a business dashboard update?
It depends on the metric and the decision it supports. Some operational information may need frequent updates, while monthly financial summaries may be sufficient for other purposes. Choose a schedule that matches the source data and business needs.
Build a dashboard around decisions
Business dashboard development should begin with a clear question: what information does your team need to make better decisions?
Choose metrics based on business objectives. Check the quality of your data, define how each figure is calculated, and design views around the people who will use them.
Start with a focused dashboard for one department or business process. Review how people use it, improve the reporting, and expand when there is a clear need.
If your business is planning a reporting dashboard or a connected business application, contact Aroxa Solutions to discuss your requirements and possible development approach.